Rebekka Fries
Projects
•
About
•
Contact
Graphic design practice for visual stories
Hi, my name is Rebekka. A graphic designer specialised in visualising social issues and its nuances.
IFFR Award Winners
Safe country
Life expectancy
Ik ben Gezond
Did not take Place
Rehearsing the Revolution
Unmapping Europe
Four graphic design blogs
Changing colors
Privacy statement (Dutch)
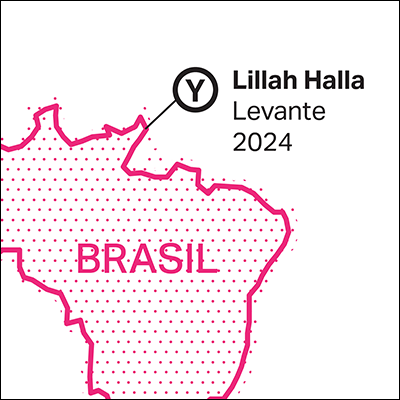 IFFR Award Winners
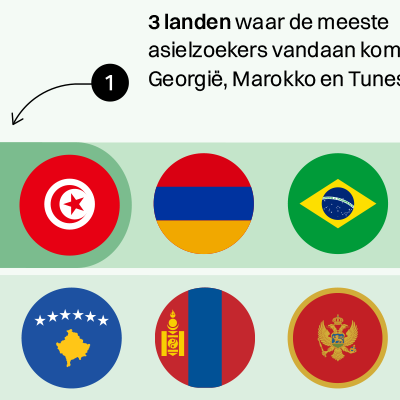 Safe country
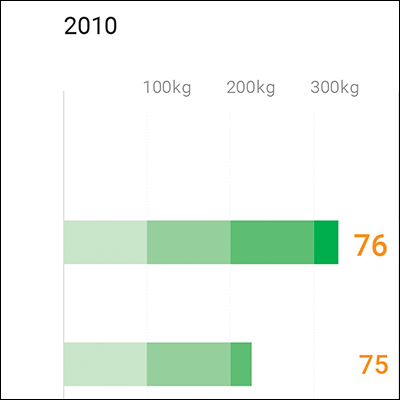 Life expectancy
 Ik ben Gezond
 Did not take Place
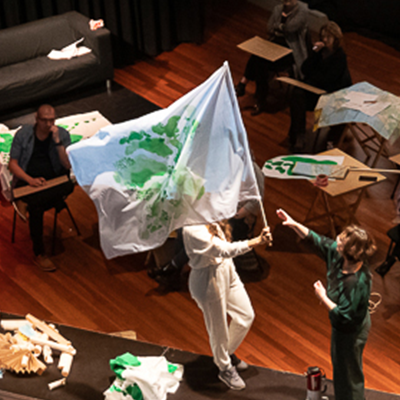 Rehearsing the Revolution
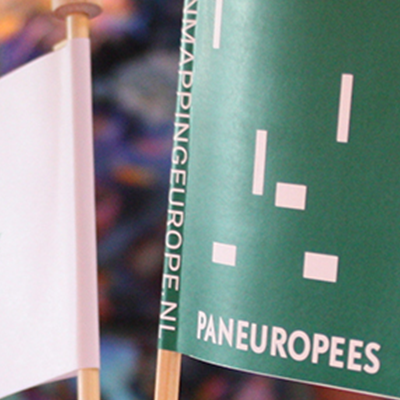 Unmapping Europe
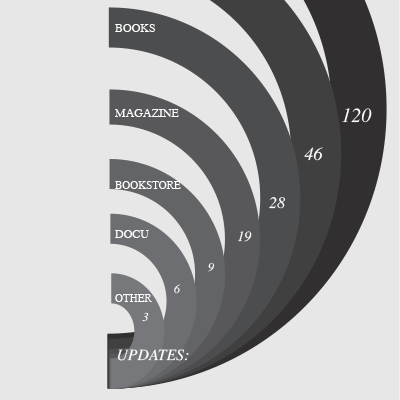 Four graphic design blogs
 Changing colors